Reports
The Dashboard shows a meter that represents your debt to income difference in a percentage scale from 0 to 100. Its kind of a cool quick glance at where you are for the month. Are you low on funds or are you higher on the scale.
The Current Month report shows a pie chart of all your payments to creditors in the current month.
The Debt report shows a pie chart of all your debt based on what you entered when you created or updated the creditor. This will change over time based on you paying down your debt.
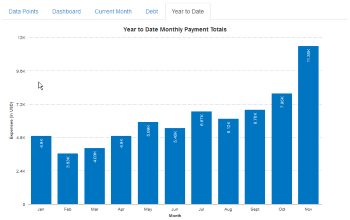
The Year to Date report is a bar chart that represents your monthly totals from the first of the year to where ever we currently are in the calender.